Most of the time you do not need a full dashboard. You just need CPU and memory at a glance while a server, node, cluster, or local machine is doing its job.
Opening a cloud console or metrics page for a quick check is slower than it sounds, especially when you only want to know whether the machine is healthy right now.
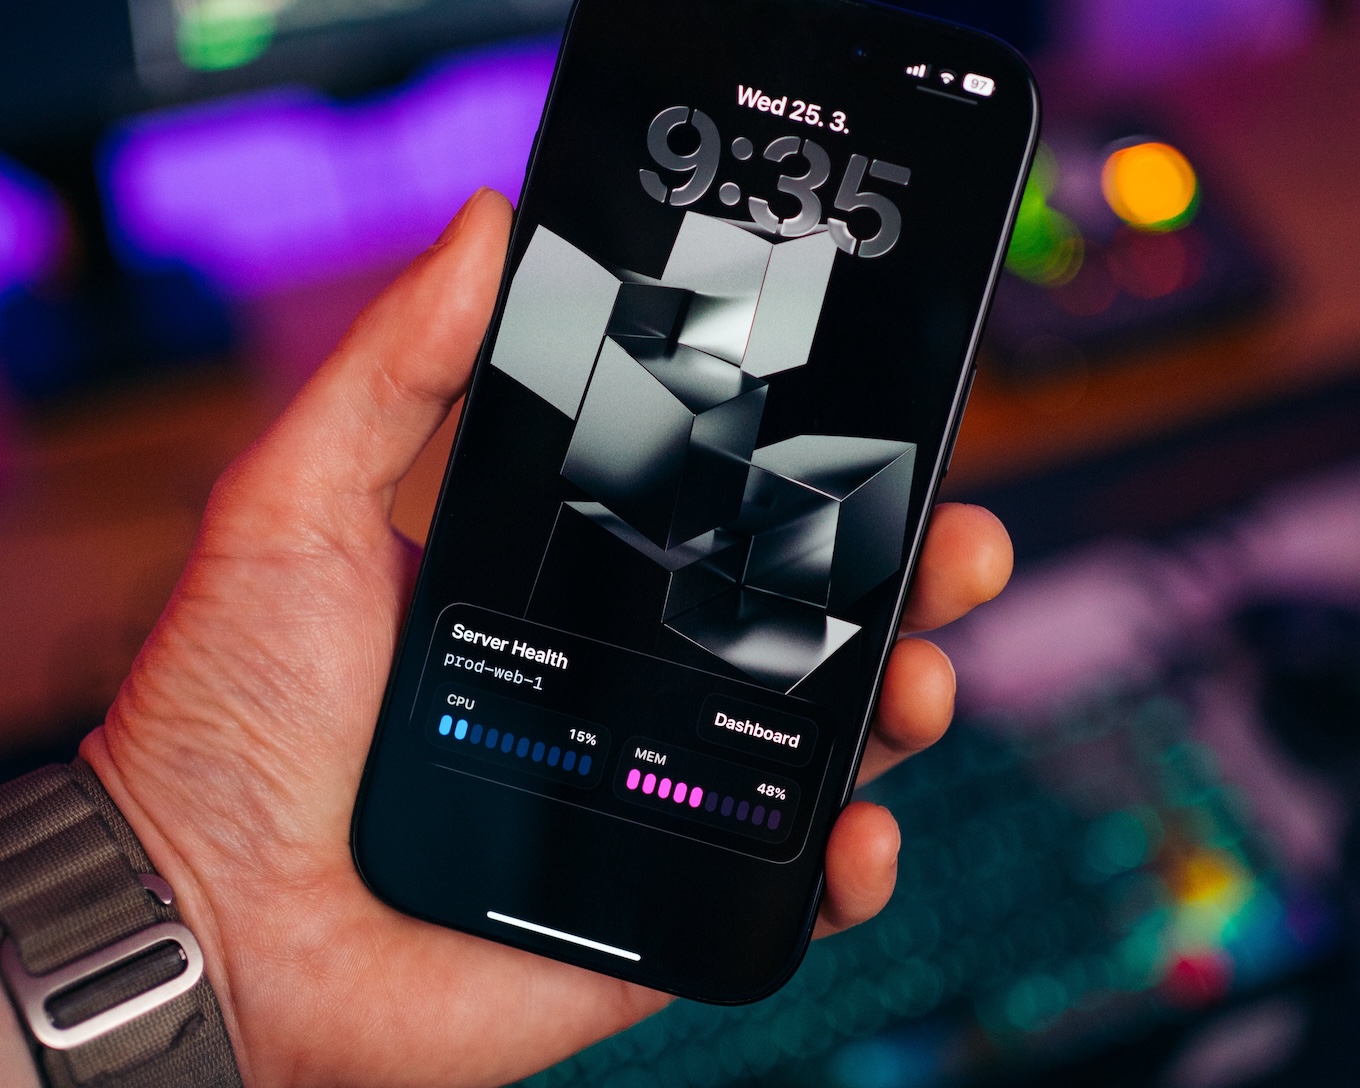
ActivitySmith keeps server health visible as a Metrics Live Activity. A cron job on the server keeps it updated so you always see the latest CPU and memory without opening a dashboard.
Before you start
ActivitySmith account
Create an account so you can generate an API key for this workflow.
API key in your runtime
Store your ActivitySmith API key as ACTIVITYSMITH_API_KEY on the machine or in the cron environment that runs the health script.
At least one paired iOS device
Pair an iPhone or iPad with ActivitySmith so the update has somewhere to appear.
Stream system health from cron
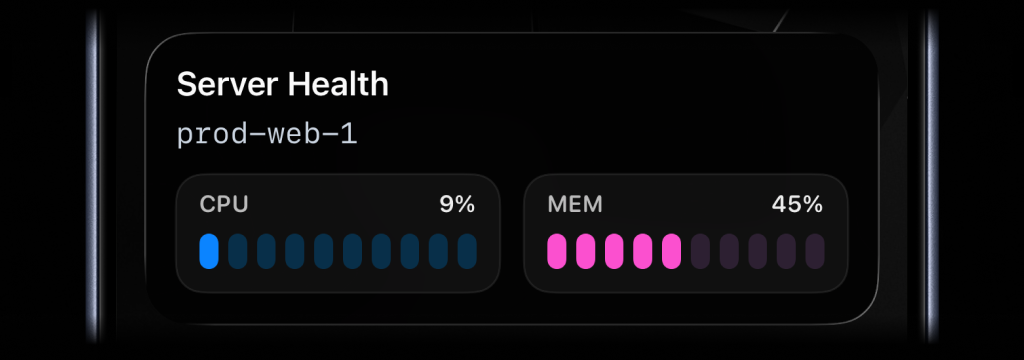
Metrics Live Activity stream
Use a metrics stream when you want CPU, memory, or other host values to stay visible without storing an activity ID between cron runs.
Step 1
Choose a stable stream key per machine
Name each server, node, or machine with a key such as prod-web-1. ActivitySmith uses that key to create or update the same Live Activity on your paired devices.
Step 2
Sample CPU and memory in Bash
Read CPU with `top -bn2` for a steadier second sample, and memory with `free` so the script stays lightweight.
Step 3
Call the stream endpoint on a schedule
Point cron at the script every minute, or on whatever interval fits your monitoring needs. Each PUT /live-activity/stream/{stream_key} call refreshes the same Live Activity.
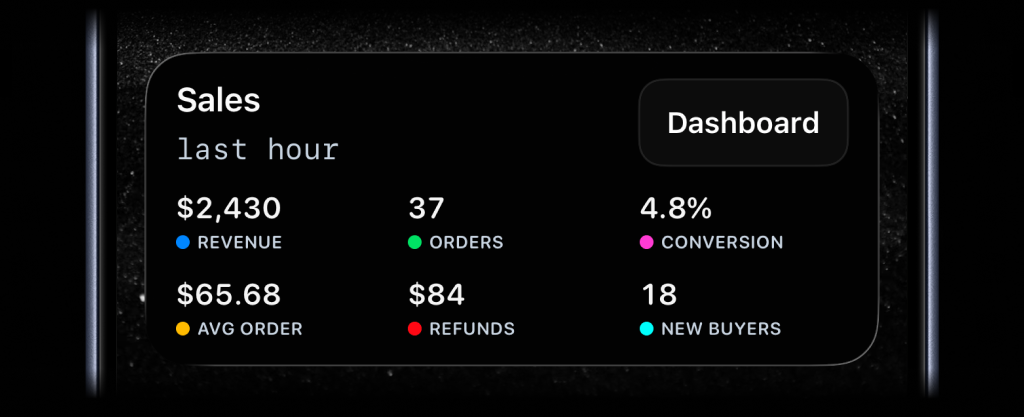
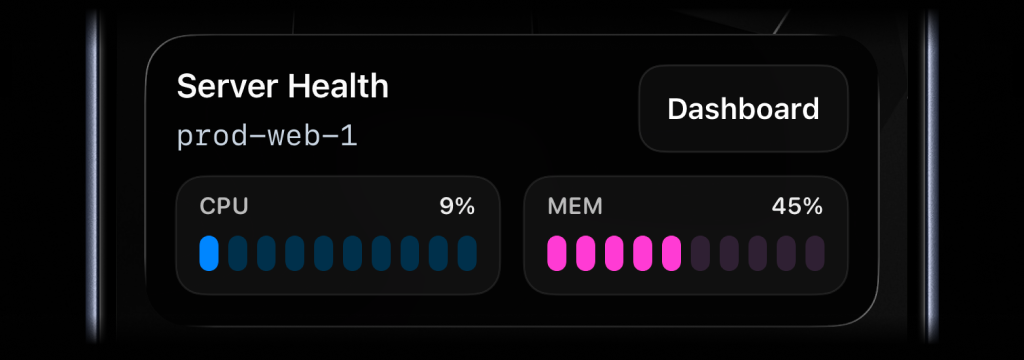
Dashboard action on the Live Activity
Add an action button when you want the Live Activity to open the host dashboard, node page, or metrics view behind the numbers.
Team visibility
Invite teammates so people responsible for infrastructure can pair their own iPhone or iPad and keep the same system health view.
Use channels to target specific people or devices, such as operations, devops, or founders.
Reference implementation
Schedule the health check with cron
Cron can run the same script on a fixed interval. Load the environment first so the script can read your ActivitySmith API key.
# /etc/cron.d/system-health-live-activitySHELL=/bin/bashPATH=/usr/local/bin:/usr/bin:/bin* * * * * root . /etc/system-health-live-activity.env; /opt/monitoring/system-health-live-activity.sh >> /var/log/system-health-live-activity.log 2>&1Stream system health from Bash
Sample CPU and memory on the machine, then send the latest values to ActivitySmith so the same Metrics Live Activity stays current on your Lock Screen.
#!/usr/bin/env bashset -euo pipefailAPI_BASE_URL="https://activitysmith.com/api"STREAM_KEY="prod-web-1"export LC_ALL=C# CPU usage (%)CPU=$(top -bn2 | awk -F'id,' '/Cpu\(s\)/ { split($1, a, ",") idle=a[length(a)] gsub(/[^0-9.]/, "", idle) cpu=100-idle}END { printf("%.0f", cpu) }')# Memory usage (%)MEM=$(free | awk '/Mem:/ { printf("%.0f", ($3 / $2) * 100) }')JSON=$(cat <<EOF{ "content_state": { "title": "Server Health", "subtitle": "prod-web-1", "type": "metrics", "metrics": [ { "label": "CPU", "value": $CPU, "unit": "%" }, { "label": "MEM", "value": $MEM, "unit": "%" } ] }, "action": { "title": "Dashboard", "type": "open_url", "url": "https://cloud.example.com/servers/prod-web-1/metrics" }}EOF)curl --fail --silent --show-error \ -X PUT "$API_BASE_URL/live-activity/stream/$STREAM_KEY" \ -H "Authorization: Bearer $ACTIVITYSMITH_API_KEY" \ -H "Content-Type: application/json" \ -d "$JSON"echoServer health without opening a dashboard
- CPU and memory stay visible on your Lock Screen without logging into a cloud console for a quick check.
- A cron job on the server keeps the same Metrics Live Activity current while you are away from the dashboard.
- A dashboard action on the Live Activity gives you a fast path when a value spikes and you need more context.
Know when a system needs attention
Keep CPU and memory visible on your iPhone Lock Screen, refreshed by a simple cron job. Glance once, spot pressure early, and open the dashboard when something looks off.